
Article
2026 Excelsa Commentary - U.S. Multifamily Real Estate
PREFACE
______________________________________________________________________________________________________________________
Excelsa is pleased to present its house view on the current state of the U.S. multifamily sector, highlighting the key dynamics and themes we believe will shape investor outcomes in 2026. Following a challenging three-year cycle, our analysis reflects a more defined perspective on the principal risks facing the sector, alongside emerging opportunities supported by underlying market fundamentals. We hope this perspective proves informative and constructive, and we welcome further dialogue on the insights presented herein.
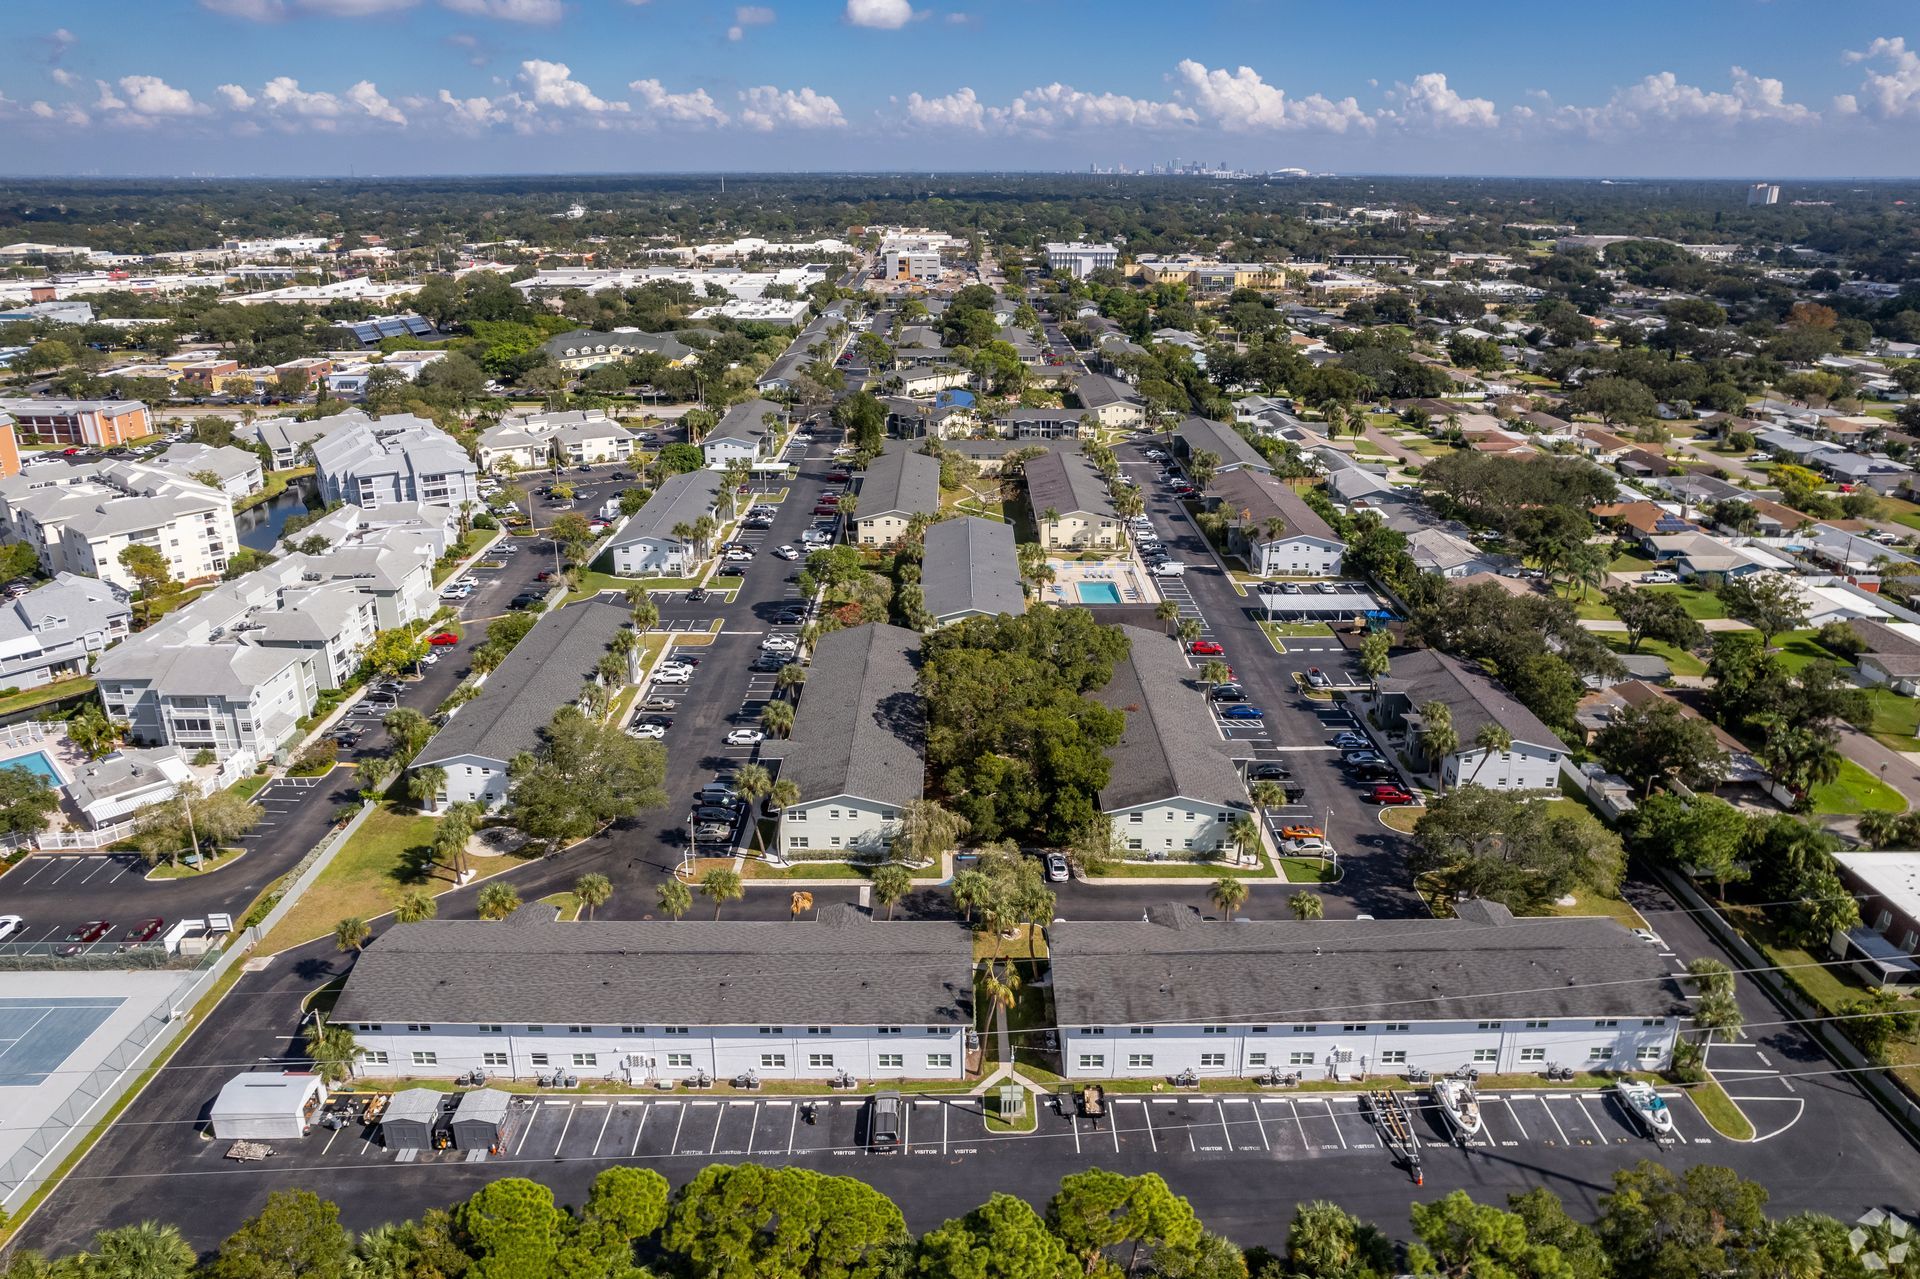
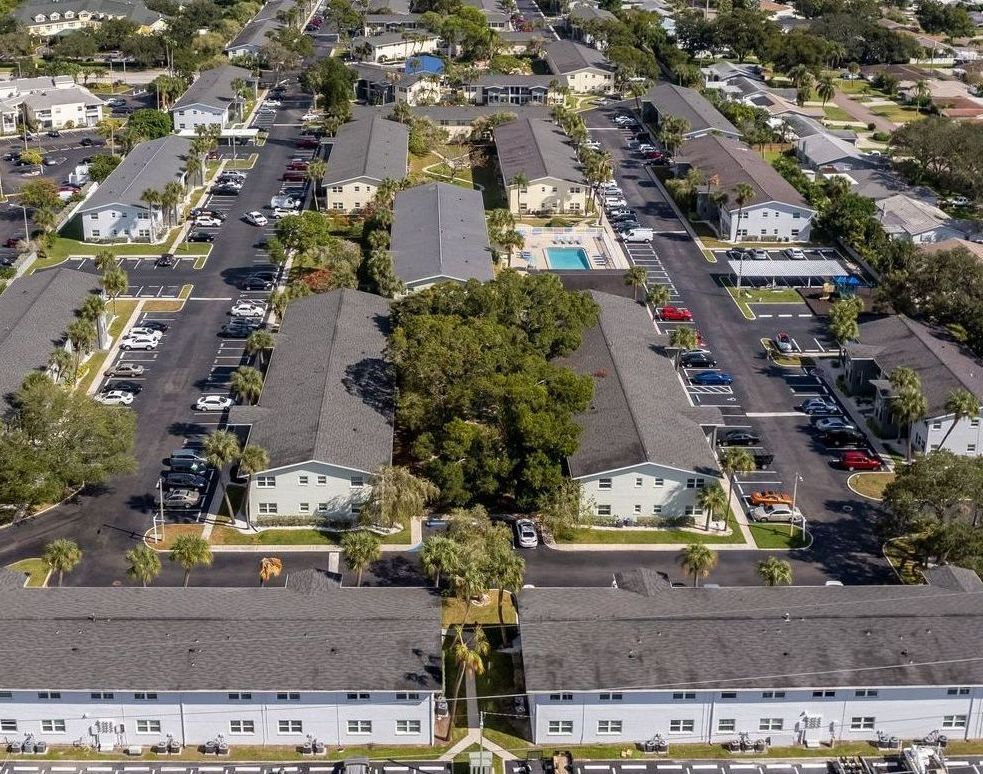
Founded in 2013, Excelsa has developed a strong track record and deep sector expertise in U.S. multifamily real estate.
A DIFFICULT THREE YEARS – AND WHY IT IS NOW LARGELY BEHIND US
______________________________________________________________________________________________________________________
Since 2022, the multifamily sector has absorbed the consequences of record construction activity undertaken during the low-rate era following the post-COVID recovery, high inflation increasing operating expenses and capital expense budgets, and one of the quickest and largest increases in interest rates in recent U.S. history.
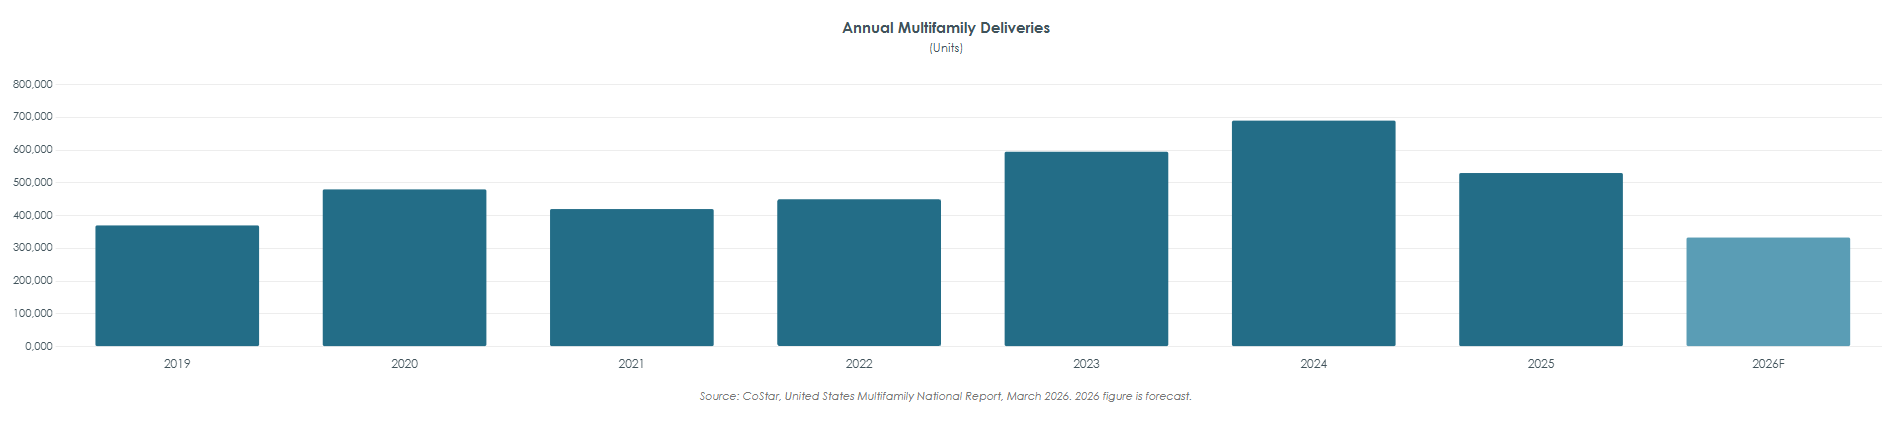
Fueled by cheap capital and strong migration demand, developers pushed supply to a 40-year high, with annual net deliveries peaking above 690,000 units (compared to a fourteen-year historical average of approximately 302,325 units per year) in late 2024.¹ The volume of new apartments hitting the market was without precedent in the modern era, flooding most of the performing markets including the Sun Belt markets and forcing operators into a prolonged defensive posture on pricing and occupancy.
For value-add Class B assets the impact was acute. Under normal conditions, a meaningful rent gap insulates Class B properties from the competitive pressure of newly delivered Class A inventory. This cycle proved different. Developers, desperate to lease up new units, offered concessions of three to four months' free rent on twelve-month leases – a level of discounting that compressed effective rents across the entire market and reached into the Class B tier.
Combined with sharp increases in insurance, labor, and utilities costs, this environment tested the resilience of even well-managed assets. Property insurance premiums in many Southeast markets doubled or more between 2022 and 2024, driven by climate-related risk repricing and carrier withdrawals.2,3 Payroll costs rose sharply as a tight labor market pushed maintenance and management wages higher. Simultaneously, the Federal Reserve’s most aggressive tightening cycle in four decades drove the federal funds rate from near zero to over 5% between early 2022 and mid-20234, with the average commercial real estate loan rate reaching approximately 6.2% by 20255 – compared to roughly 3.5% on much of the debt originated just years earlier.6 This rate shock effectively froze the transaction market for nearly three years, as buyers and sellers could not agree on valuations, and owners with maturing debt faced refinancing costs that eroded equity. The combination of compressed revenues, elevated operating costs, and a hostile capital market environment created the most challenging operating conditions the multifamily sector has experienced since the early 1990s.
That period is now drawing to a close. Annual supply had already fallen to approximately 530,000 units in 2025, and is expected to decline a further 36% in 2026 to approximately 333,000 units – the lowest level since 2014.¹ Construction starts have hit their lowest point in over a decade, pressured by declining rents, higher capital costs, and tighter lending standards. The chart below illustrates the scale of the supply wave and its expected decline.
EARLY SIGNS OF RECOVERY
______________________________________________________________________________________________________________________
The correction that the market required is underway, and early operational data is beginning to reflect it. According to RealPage Market Analytics, U.S. apartment occupancy rose in both January and February 2026 – the first back-to-back monthly occupancy increases in two years – reaching 94.9% nationally by end of Q1. Demand also surprised to the upside: Q1 2026 absorbed approximately 93,300 units, one of the strongest first-quarter performances in the past decade.7
On rents, the picture is more nuanced and warrants objective framing. Year-over-year rent growth nationally remains near zero – approximately +0.2% on asking rents.1 However, the directional shift is clear: rents rose in Q1 2026 for the first time after two consecutive quarters of declines. The Class B / Renter-by-Necessity segment is outperforming the broader market, posting +0.7% year over-year rent growth against –0.4% for the Lifestyle (Class A) segment.8 This divergence reflects the structural reality that the supply wave consisted overwhelmingly of high-end product: approximately 85% of recent completions were 4 & 5 Star buildings.1 The Class B segment was impacted by spillover concession activity, not by its own supply imbalance – and it is recovering faster as those concessions burn off. The geographic dispersion of performance is significant and warrants acknowledgement. Gateway and Midwest markets are leading the recovery: New York City is posting year-over-year rent growth of +4.5%, San Francisco +3.9%, and Chicago +3.4%.8 These markets benefit from constrained supply pipelines and strong demand anchored in technology and financial services employment. In contrast, high-supply Sun Belt markets continue to face headwinds: Austin is down 4.1% year-over-year, Tampa down 3.4%, and Phoenix down 3.2%. The Southeast markets sit in an intermediate position – Charlotte and Nashville are still negative year-over-year, reflecting the overhang of recent deliveries, but both markets have among the strongest job growth in the nation (Charlotte +2.7%, Raleigh +1.6% year-over-year)8 and rapidly thinning supply pipelines. The rent recovery in these markets is a matter of timing, not direction.
Concessions remain elevated market-wide at approximately 25% of apartments, with an average incentive of 7.2%7 – down from higher levels seen in late 2024 and early 2025, but not yet fully normalized. This is important context: it means that the full transmission of the demand recovery into rent growth will be gradual, not immediate. We do not expect a sharp rent rebound; we do expect a steady, durable improvement through the second half of 2026 and into 2027 as concessions normalize and supply continues to abate. Some operating cost lines – notably insurance and payroll – are also beginning to moderate, providing a secondary tailwind to net operating income recovery. CoStar forecasts overall vacancy to plateau through 2026 before declining meaningfully from 2027 onward.1
GEOPOLITICAL CONTEXT
______________________________________________________________________________________________________________________
The U.S.-Israel-Iran conflict, which commenced on 28 February 2026, disrupted global energy markets and introduced a layer of macro uncertainty. The near-closure of the Strait of Hormuz generated a significant oil price shock, with Brent crude reaching approximately $120 per barrel at peak.9 The transmission to U.S. real estate has been principally through energy-driven inflation, which pushed mortgage rates back above 6% and complicated the Federal Reserve’s rate cutting path. Prior to the conflict, markets anticipated 50 basis points of Fed rate cuts in 2026; analysts now consider the possibility that rates may move higher rather than lower this year.1
As of 9 April 2026, a ceasefire between the U.S./Israel and Iran has come into effect. If this holds and leads to broader de-escalation, energy markets would normalize over time, reducing inflationary pressure and reopening the path to rate relief – though a full rebalancing of energy markets is likely to take longer than the ceasefire itself, given structural disruptions to shipping, insurance, and storage capacity that have built up since February. A prolonged conflict could sustain inflationary pressure and delay rate normalization further. In this environment, one must remain disciplined in one’s underwriting, reflecting the potential for continued volatility. Crucially, higher mortgage rates and sustained inflation – whatever their cause – tend to reinforce rather than undermine multifamily demand: these are precisely the conditions that keep would-be homebuyers in the rental market, strengthening tenant bases and renewal rates.
On the question of recession risk: a prolonged conflict scenario would weigh on U.S. and global economic growth, but a U.S. recession is not our base case. More broadly, regardless of shifting global sentiment, the U.S. remains one of the most resilient and investable real estate markets in the world – underpinned by its depth, liquidity, and relative economic self-sufficiency. CoStar has revised its 2026 U.S. GDP growth forecast down by approximately 40 basis points to 2.4% – a meaningful reduction, but one that still reflects positive, if moderate, expansion.1 Even in a slowergrowth environment, multifamily rental demand has historically proven resilient: households continue to need housing through economic cycles, and the barriers to homeownership that underpin rental demand become, if anything, more pronounced when consumer confidence softens.
THE OPPORTUNITY
______________________________________________________________________________________________________________________
Beyond the improving operational picture, the current environment is generating acquisition opportunities not seen since before the pandemic. Three forces are converging to create this window.
First, pricing has reset materially. CoStar’s repeat-sale index shows multifamily values currently 21% below the 2022 peak, having stabilized from a trough of 27% below that same peak.1 Cap rates for 3-Star assets are clustering in the 5.75%–6.25% range, with transactions pricing near $175,000–$250,000 per unit. This represents genuinely attractive entry pricing for well-located assets with clear value-add upside.
Second, a significant maturity wall is surfacing motivated sellers. Approximately $162 billion in multifamily loans mature in 2026, a 56% increase from the prior year.10 A significant portion were originated at 2021–2022 rates and now face a meaningful refinancing cost gap. For wellcapitalized, stabilized assets, agency refinancing capacity remains robust: the Federal Housing Finance Agency has expanded combined Fannie Mae and Freddie Mac lending caps to $176 billion for 2026, a 20% increase over 2025.11 It is the overleveraged and underperforming assets that face genuine distress – and those are precisely the acquisition opportunities this environment is surfacing. This is already surfacing assets at valuations that reflect near-term uncertainty rather than long-term fundamentals – precisely the conditions in which disciplined value-add investors generate their strongest vintages.
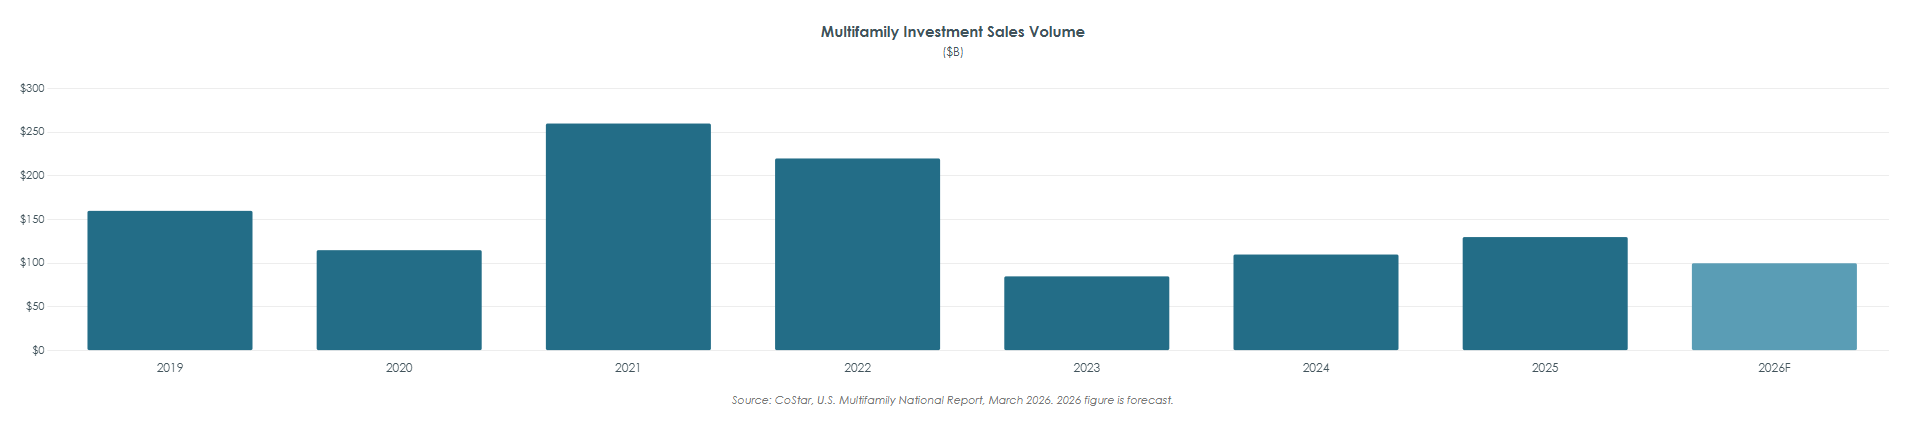
Third, institutional capital has not yet fully returned. This is arguably the most important observation. Transaction volumes are recovering – trailing four-quarter investment sales volume rose 31% year-on-year as of Q1 2026, with deal count approaching 2019 levels1 – but the composition of buyers tells the real story. Private investors account for over half of acquisitions; institutional managers represent approximately one quarter, still well below their historical share. The chart below illustrates the contraction and recovery in sales volumes.
This gap between private and institutional participation represents a well-defined window: the ability to acquire assets ahead of the full re-entry of institutional demand, at prices that will compress as that capital returns. In our experience, the most attractive vintage years are precisely those in which the broader market remains hesitant.
The Southeast continues to be well positioned at this moment. Our geographic focus on the Southeast continues to position us well for this moment. Despite near-term rent pressure in high supply markets, the region’s structural advantages – population inflows, employment growth, relative affordability, and supportive regulatory environments – remain firmly intact. As supply digestion progresses, the Southeast is expected to outperform on both rental growth and investment returns through the balance of this decade.
SOURCES
______________________________________________________________________________________________________________________
1. CoStar Group - United States Multi-Family National Report, April 2026
2. Federal Reserve Board - Rising Property Insurance Costs and Pass-Through to Rents for Apartment Buildings (September 19, 2025)
3. Fannie Mae - Multifamily Economic and Market Commentary: “Higher Insurance Premiums Continue to Impact the Multifamily Sector” (May 2024)
4. Mortgage Bankers Association - 2026 CREF Forecast (February 9, 2026)
5. IPA Commercial Real Estate - Your Guide to Commercial Real Estate Interest Rates (July 1, 2025)
6. Deloitte - 2026 Commercial Real Estate Outlook (September 29, 2025)
7. RealPage Market Analytics - Apartment Demand Rebounds in 1st Quarter as Supply Volumes Continue to Slow
8. Yardi Matrix - Multifamily National Report, March 2026
9. CNBC - A Timeline of How the Iran War Shook Oil Prices — and What Comes Next (April 21, 2026)
10. MMG Research - The 2026 CRE Refinancing Wall: Opportunities in Multifamily Distress (November 2025)
11. Federal Housing Finance Agency (FHFA) - 2026 Multifamily Lending Cap Announcement (November 2025)
IMPORTANT INFORMATION
______________________________________________________________________________________________________________________
This document has been prepared by Excelsa for informational and educational purposes only. It constitutes a general market commentary and does not relate to any specific investment opportunity, offering, or transaction. This document does not constitute, and shall not be construed as, an offer to sell, a solicitation of an offer to buy, or investment advice in respect of any securities, interests, or financial products in any jurisdiction. Nothing in this document should be relied upon as the basis for any investment decision. Any reproduction or distribution of this document, in whole or in part, without prior written consent from Excelsa is prohibited. This document contains forward-looking statements regarding possible or assumed future results of the business, financial condition, plans, and objectives of Excelsa Properties and its subsidiaries and affiliates (collectively, “Excelsa” or the “Company”). Any statement concerning future events or expectations, express or implied, is a forward-looking statement. Words such as “may,” “will,” “seek,” “should,” “expect,” “anticipate,” “project,” “estimate,” “intend,” “continue,” or “believe,” or the negatives thereof or other variations thereon or comparable terminology, are intended to identify forward-looking statements that are subject to risks and uncertainties. There can be no assurance that any expectations, expressed or implied, in any forward-looking statement will prove correct or that the contemplated event or result will occur as anticipated. In particular, there can be no assurance that Excelsa will achieve any performance objectives set forth in this document. Any forward-looking statement speaks only as of the date on which it is made. New risks and uncertainties arise over time, and it is not possible for Excelsa to predict those events or their effect on the Company. Except as required by law, Excelsa is not obligated to update or revise any forward-looking statements, whether as a result of new information, future events, or otherwise. The views and opinions expressed herein reflect Excelsa’s assessment of market conditions as of the date of publication and are subject to change without notice. They are based on sources believed to be reliable but are not guaranteed as to accuracy or completeness. All market data referenced herein is sourced from third-party providers, including Yardi Matrix, RealPage Market Analytics, and CoStar Group. Excelsa has not independently verified all underlying data and makes no representation as to its accuracy. This document is intended for general circulation and informational purposes only and does not constitute legal, tax, or financial advice. Recipients should consult their own advisors before making any investment decision. This document is not intended for distribution in any jurisdiction where such distribution would be contrary to applicable law or regulation. Receipt of this document does not create any advisory, fiduciary, or other relationship between Excelsa and the recipient. All dollar figures refer to the U.S. Dollar. “Excelsa” is a registered trademark of Excelsa Operations in the United States and other jurisdictions.
Related Articles